Archive for December 2012
HANA Modeling Target: Minimize Data Transfers
The main goal during modeling is to minimized Data transfers.
This is possible true both internally, between the SAP HANA database views, and also between SAP HANA and the end user application.
So for example, the end-user will never need to see 1 million rows of data.
They would never be able to understand so much information or consume it in some meaningful way.
So data should be aggregated and filtered to a manageable size before it leaves the data layer.
When deciding upon the records that should be reported,
the best practice approach is to think at a “set level” not a “record level”.
A set of data can be aggregated by a region, a date, or some other group in order to
minimize the amount of data passed between views.
Read related post:
The universe does not allow using a complex expression in a GROUP BY statement. You cannot run this query. See your Business Objects administrator. (Error: WIS 00010)
Cause
A query contains a GROUP BY clause that uses formulas or aliases. The universe does not allow these expressions in GROUP BY clauses. The behavior is determined by the parameter
Y
in the PRM file for the target RDBMS.
Action
You have two solutions:
• Modify the query so that objects using formulas or aliases are not included in the query.
• A universe designer can open the PRM file for the target RDBMS and change the value for the parameter GROUPBY_EXCLUDE_COMPLEX to N. This change should be made only if you are sure that your RDBMS supports complex GROUP BY expressions.
Please note:
The parameter GROUPBY_EXCLUDE_COMPLEX by default is ‘N’ .
Check your .prm file in your environment and change accordingly.
See also:
BUSINESS OBJECTS ERRORS LIST
SAP HANA Database Concepts: Tables, Models and View Processing
SAP HANA database is a very capable database system but it requires some understanding, and to be
used correctly, to obtain good performance. Let’s see the key concepts of the SAP HANA database.
We will explain how approach modeling in order to to achieve best results.
The SAP HANA database allows you to model your data as tables and views.
Tables are tabular data structures, each row identifying a particular entity, and each column having a unique name.
The data fields of one row are called the attributes of the entity. The word “attribute” is used with different
meanings. It may refers to a table column, a particular data field of a table row, or the contents of such a data field. The respective meaning will be clear from the context.
Views are combinations and selections of data from tables modeled to serve a particular purpose.
Views always appear like readable tables, i. e. database operations which read from tables can also
be used to read data from views.
SAP HANA can use several types of views.
In analytics applications star schemas are a general pattern: Fact tables are lists of business transactions
while the linked-in data are typically master data. These linked-in tables are often called dimension tables.
A fact table surrounded by its linked-in dimension tables is often called a star schema because of the geometry of its graphical model.
In SAP HANA a star schema can be created using tables or views by surrounding an analytic or calculation view with attribute views.
SAP HANA Modeling Views
Before we continue to discuss how to model in SAP HANA, first it is important to understand each of
the differing SAP HANA modeling view types and their capabilities.
Attribute Views
Attribute views are used to give master data tables context. This context is provided by text tables
which give meaning to the master data. For example, if our fact table or analytic view only contains
some numeric ID for each dealer then we can link in information about each dealer using an attribute view. We could then display the dealers’ names and addresses instead of their IDs thus providing the context for the master data table.
Attribute views are used to select a subset of columns and rows from a data table. As it is of little use
to sum up attributes from master data tables there is no need to define measures or aggregates for attribute views.
You can also use attribute views to join master data tables to each other, e. g. joining “Plant” to “Material”.
Analytic Views
Analytic views are used to build a data foundation based on transactional tables. You can create a
selection of measures (also knew as key figures), add attributes and join attribute views.
Analytic views leverage the computing power of SAP HANA to calculate aggregate data, e. g. the
number of sold cars per country, or the maximum power consumption per day.
They are defined on at least one fact table, i. e. a table which contains e. g. one row per sold car or one row per power meter reading, or more generally speaking, some form of business transaction records.
Fact tables can be joined to allow access to more detailed data using a single analytic view.
Analytic views can be defined on a single table, or joined tables.
Analytic views can contain two types of attributes (or columns), so-called measures and normal
attributes. Measures are attributes for which an aggregation must be defined. If analytic views are used in SQL statements then the measures have to be aggregated e. g. using the SQL
functions SUM(), MIN(), or MAX(). Normal attributes
can be handled as regular columns. For them there is no need to be aggregated.
Calculation Views
Calculation views are used to provide composites of other views. They are essentially a view which is
based on the result of an SQLScript. These scripts can join or union two or more data flows or invoke
built-in or generic SQL functions.
Calculation views are defined as either graphical views or scripted views depending on how they are
created. They can be used in the same way as analytic views, however, in contrast to analytic views it
is possible to join several fact tables in a calculation view. Calculation views always have at least one
measure.
Graphical views can be modeled using the graphical modeling features of the SAP HANA Information Modeler.
Scripted views are created as sequences of SQLScript statements (i.e SQLScript procedures)
SAP HANA View Processing
A basic understanding how SAP HANA processes views is required so that you can ensure that data
transfer within the database system is minimized.
A simplified view of the system is illustrated below.
From the diagram we can see that SAP HANA has three types of views that are used based on the
requirements of the model.
- Calculation views – used on top of analytic view and attribute views to perform complex calculations that cannot be achieved by the attribute or analytic views alone.
- Analytic views – used for calculation and aggregation “based on star schema” or similar
- Attribute views –used for all type of joins
An SQL optimizer decides the best way to call the differing functions of the database system based
on the models and queries involved.
This diagram is in someway simplified. So for example an analytic view with a calculated attribute or that
includes an attribute view containing a calculated attribute, will become a calculation view.
This should be taken into consideration during modeling because it can have a large impact on the
performance of the data model.
Read related post:
SAP HANA Modeling Guidance
SAP HANA Data Modeling and Data Replication
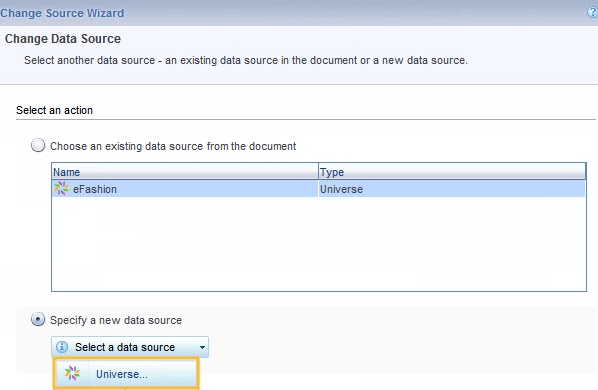
Let see how to change the data source in a existing Webi report.
Open the Webi report
select the ‘Data Access’ tab
Select the ‘Tools’ menu under Data Access tab
Select the Change Source Menu
Select the Query to which you need to change the data source
Select the Specify a New Data source Flag
Select the wanted Universe
Check that all the new query objects match to the old ( as in this image)
Unable to connect to service from server via CMS (FWM 01006)
Environment SAP BI 4
DB SqlServer2008
Cause
Unable to connect to the service through the CMS.
Action
Log on to the CMC and ensure that the service is running on the appropriate server.
Solution
In our case we have disabled, stopped and then enabled and started the WebiProcessing Server.
See also:
Using SAP Visual Intelligence – Step by Step
Let’s see how to create a chart with Visual Intelligence.
1. Connect to your data source
If your data source is:
– RDBMS: Enter your credentials, connect to the database server, browse and select a data source.
If you are connecting to SAP HANA, you select a view and cube to build your chart.
– Flat file: Choose the columns to be acquired, trimmed, or shown and hidden.
– Universe: Enter your universe credentials, connect to the Central Management Server repository, and select a universe to build your chart.
2. View and organize the columns and attributes.
The data acquired can be viewed as columns or as facets. You can organize the data display to make chart building easier by doing the following:
– Create filters and hide unneeded columns.
– Create measures, time and geography hierarchies.
– Clean and organize the data in columns using a range of manipulation tools.
– Create columns with formulas using a wide selection of available functions.
Below a data grid in Visual Intelligence.
3. Choose a chart type.
You can build charts using:
– Split view that shows the dataset and the chart being built.
– Visualize view to work in a totally graphical environment when building your chart.
The selection of charts is arranged by family at the top of the Visualization pane.
In the following images is shown how to choose a chart:
4. Build your chart
You can build charts in three ways:
– Using the Chart feeder panel to the left of the Visualization Pane.
– Directly on the chart body area by dragging measures and attributes onto the chart body.
– Directly on an attribute: Select an attribute or measure, click the arrow to the right of the object name and select Make a new chart with or Add to current chart from the context menu.

5. Save your document
Name and save your document that includes your charts. It is stored locally in the application folder under Documents in your profile path.
6. Share your data or chart
You can do the following with your data, chart, or both:
– Share your chart
– Export your dataset to a file
– Publish your data to SAP HANA as an analytic view
– Publish your data and charts to Streamwork
Related posts:
SAP Visual Intelligence
SAP VISUAL INTELLIGENCE FEATURES
Connect SAP Visual Intelligence to data sources
Improving SAP BO Dashboard performances Decalogue
1. Avoid Excel formulas if is possible so Try to reduce using formulas as much you can
2. Un-nest Excel formula if you can
3. Avoid linking cells
4. Avoid array Excel functions like sumif, sumproduct
5. Limit dashboards components number
6. Reduce or avoid container components
7. Try to make a simple dashboard model in order to make also simple and easy it’s maintenance and it’s evolution
8. Prefer QaaWS to LiveOffice when connecting to many universes otherwise it’s better using Webi Reports because you can load heavy data by scheduling Webi reports, besides in Webi it’s easier to do calculations and values formatting .
9. Inorder to improve dashboard performances schedule Webi reports, better if not at the same time.
Database error occur. The error message is : (CS) “DBDriver failed to load : Installdir\win32_x86\dataAccess\connectionServer\dbd_oci.dll (the module cannot be found)”. (WIS 10901)
Environment:
Business Objects XI R 3.1
DB Oracle 11g
When opening a Webi report on infoview, the above error is generated,while Webi rich client works fine.
Cause
The problem can be explained because the WebI Rich Client uses your local connection settings while infoview uses those on the Business Objects server. So you need to check that the server has same DB access of your local machine. Besides you need to keep in mind that the permissions depends by the service account, so if your service runs under local account then you need to check the security policy on this account.
Solution
You need to check the following points:
1. If you have not an Oracle client on your client You need to install it
2. Set the ORACLE_HOME
3. Check whether TNS.ORA is set up properly and there is only one entry in the system.
Read the related post:
Error WIS 10901 Database error:[Microsoft][ODBC SQL Server Driver]Transaction was deadlocked
BUSINESS OBJECTS ERRORS LIST
Let’s see how create a simple Sales Dashboard which has as main component the
Accordion menu
which allows to have a multiple level hierarchical filtering.
This means that you can first select the top level hierarchy dimension in our case the ‘Country’ and then you can choose one of the ‘Products’ sold in the selected country:
The columns chart shows the sales for that kind of bike in the months of the year.
In the following image you will see how data changed when you select an other kind of product
Below you can see how create the Excel file in order to create this dashboard.
In the yellow are will be drilled the months sale data after selecting the two hierarchical dimensions.
Under this line there are different tables for each Country that can be selected which contains sales data per product for each months.
Below is detailed how to set the Accordion Menu
You can find the related files on SAP COMMUNITY NETWORK,
in the following link another example with related files:
USING THE ACCORDION MENU
For more Dashboards templates and example:
Xcelsius Dashboard template files
XCELSIUS SALES DASHBOARD TEMPLATE
Max character file size limit exceeded. The document is too large to be processed by the server.
Contact your BusinessObjects administrator. (WIS 30272)
Cause:
When you view a Web Intelligence document in HTML format, the Web Intelligence server generates character based output, which is then interpreted by your web browser. This errors occurs, if the size of the
character output is greater than the maximum size specified by your administrator for the Web Intelligence server.
Solution
The administrator can change the parameters set for Maximum character output on the Administration Console.
Please note that however, increasing the maximum binary output can affect performance.
Log on
CMC -> servers -> Web Intelligence Report Server -> Properties
Maximum Binary File Size:
Maximum Character File Size:
The Binary file size shold be for PDF; the character size is for webi reports.
You have to increase you current limits until the error will be solved.
See also: